Carbon Data - One Klere Platform
Clear, reliable carbon reporting:
Klere provide carbon footprint data for sustainability consultants and corporate sustainability managers faced with complex supply chains or hard-to-collect data. Data needed for disclosure and baseline measures for strategic actions.
Our methodology avoids the need to allocate resource to gathering meter readings, mileage logs, or lengthy supplier questionnaires — we make carbon reporting clear and transparent. Using standard company expense data the methodology fully aligns with GHG Protocol principles and is trusted by leading UK organisations. Where activity based data for Scope 1, 2 and 3 is available, we can integrate the two approaches.
In addition, Klere's Carbon metric works seamlessly with our nature impact metric. All results displayed in one clear platform.


Built for Business & Complex Supply Chains
Klere’s Carbon metric cuts through the complexity making it accessible to SME's as well as larger organisations.
AI enabled, we can handle very large datasets — up to hundreds of thousands of supply items — going well beyond the limits of activity-based analysis.


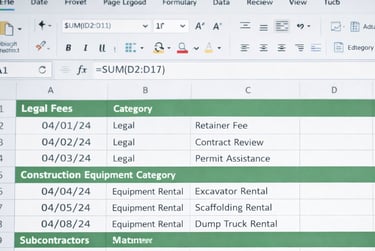
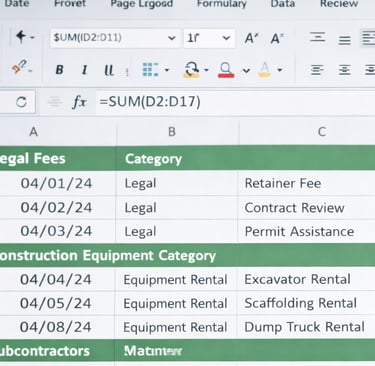
Expenses data provided from company accounts
Data is cleaned, catagorized & entered by our team
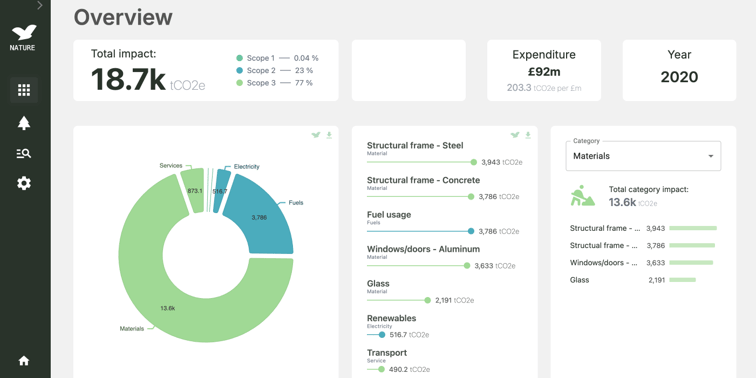
Data presented on our interactive platform, report ready
Simple three step process:


How...
Our conversion factors use the EXIOBASE multi-regional input-output tables, a trusted methodology for Scope 3 reporting. Where activity based data for Scope 1, 2 and 3 is available, we can integrate the two approaches. Accuracy can be validated through cross comparisons.
Trusted by leading organizations including the BBC
Contact us for a demonstration and test run with your data.
Client Case Study
In 2024, a UK leading property claims management organisation, MA Group, collaborated with Klere to measure their carbon footprint across operations and supply chain activities. Using advanced spend-based analysis, Klere transformed complex data into practical insights aligned with global standards.
Key Insights
Central Operations: Emissions were primarily Scope 3, driven by vehicle fuel, electricity, and IT support.
Supply Chain: Significant emissions came from decorating, building works, and waste, which had the highest carbon intensity.
Intensity Ratios: Emissions per revenue and employee highlighted key efficiency opportunities.
Challenges Addressed
Klere processed large, complex datasets, streamlining information into actionable categories.
Results
Identified waste management as a priority for reduction.
Delivered clear, visual insights via Carbon Dashboard for annual report.
Proposed strategies to optimise data and improve reporting accuracy.
Robust emissions baseline and workable solutions, advancing their sustainability goals.


Klere Limited
Nature data and carbon capture.
enquiries@klere.uk
Tel: 0203 583 1263
© 2024. All rights reserved.