Carbon & Nature Data In One
Klere’s Carbon Accounting
Measure carbon impacts across complex supply chains and hard-to-collect datasets for scope 1,2,3 with clear data visualisation to reveal where your carbon pressures sit.
Our AI-enabled platform uses standard company expense data to process huge datasets quickly, including hundreds of thousands of supply items. We identify supplier hotspots, carbon priorities by activity, and opportunities for reduction & procurement action.
Where activity-based data is available, we combine it with expense-based analysis to improve accuracy and depth of analysis.
From SMEs to councils and large multi-group organisations, we make disclosure-ready carbon data that is clear, scalable and cost-effective. From there, we partner with you to make meaningful, impactful decisions and action plans.
Expenses data provided from company accounts
Data is cleaned, catagorized & entered by our team
Data presented in platform, hot spots identified, insights reported, next steps for action
Simple three step process:


How do we do it?
Our platform uses peer-reviewed, industry accepted methodologies in the GHG protocal. Where activity based data for Scope 1, 2 and 3 is available, we can integrate the two approaches. By combining measures in one platform, we reveal biodiversity costs, nature impacts, risks and dependencies as well as carbon footprint in one. Get in touch to discuss our methodology in-depth.
Trusted by leading organizations including the BBC
Carbon Data to Results
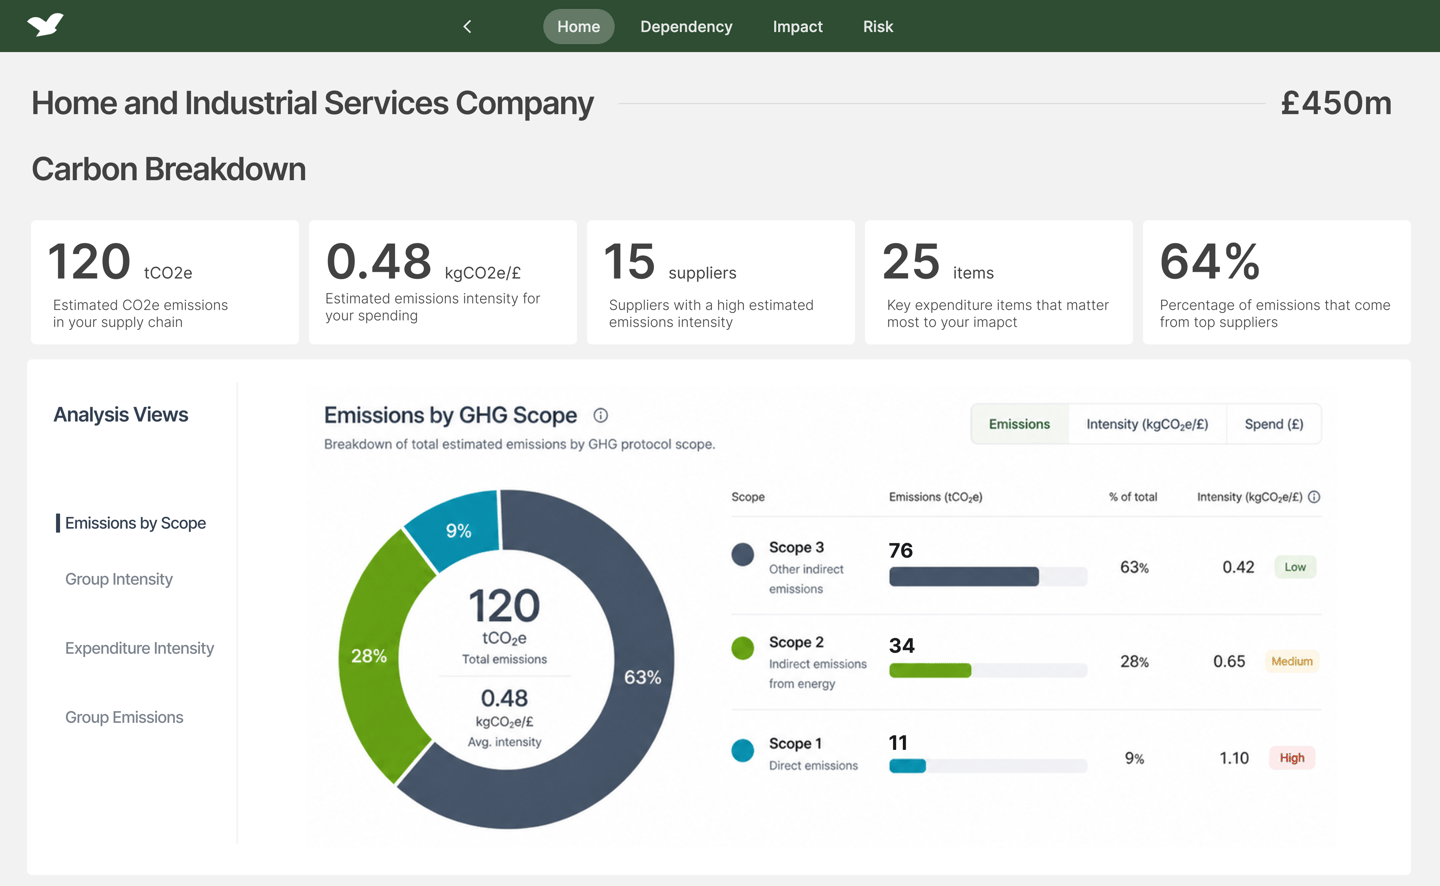
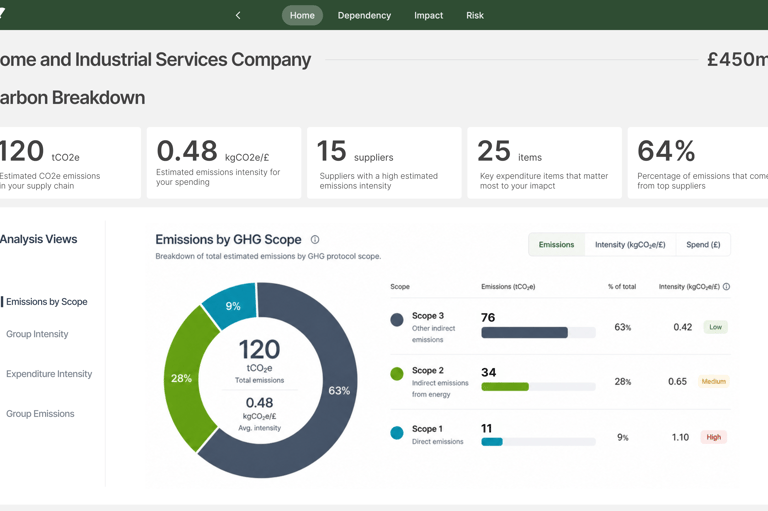
Leading property claims management organisation, MA Group, worked with Klere to measure their carbon footprint across operations & supply chains. Using spend-based data, Klere transformed complex data into practical insights aligned with global standards.
Key Insights
Central Operations: Emissions by scope, identifying Scope 3 hotspots
Supply Chain: Significant emissions suppliers identified
Intensity Ratios: Emissions per revenue and employee highlighted key efficiency opportunities.
Challenges Addressed
Klere processed large, complex datasets, streamlining information into actionable categories from business activity to identifying supplier impacts.
Results
Priorities identified for reduction.
Delivered clear, visual insights via Carbon Dashboard for annual report.
Proposed strategies to optimise data and improve reporting accuracy.
Robust emissions baseline


Klere Limited
Nature data and carbon capture.
enquiries@klere.uk
Tel: 0203 583 1263
© 2024. All rights reserved.