Why just measure Carbon when you can have Nature too...

We need to understand more than carbon. We need to know where businesses impacts nature too.
Dependencies: Rank your highest nature dependencies across eco-systems - what does your business rely on?
Impact Areas: Know your nature pressure points- prioritising highest impacts by activity. Find the cost in Biodiversity Unit equivalent for each operation, material and along the supply chain.
Risks: Nature risk and double materiality
We help you understand risk in both directions.
First, the risks nature creates for your business
Second, the risks your business creates for nature: impacts on land, water, biodiversity, habitats across operations & value chain.
A Desktop-Based Solution
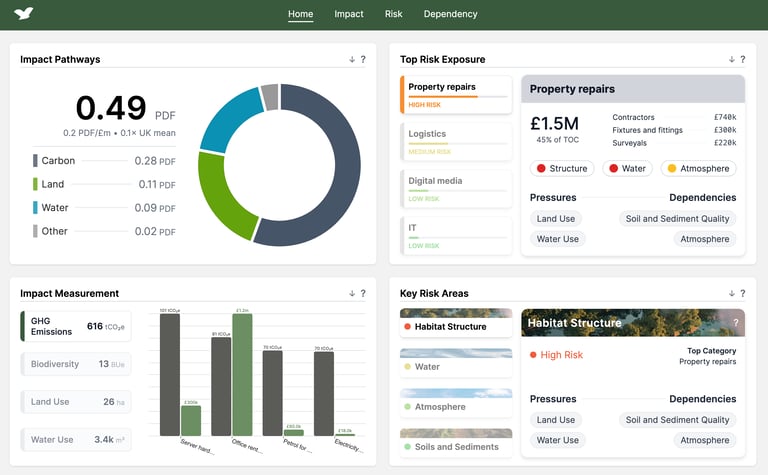
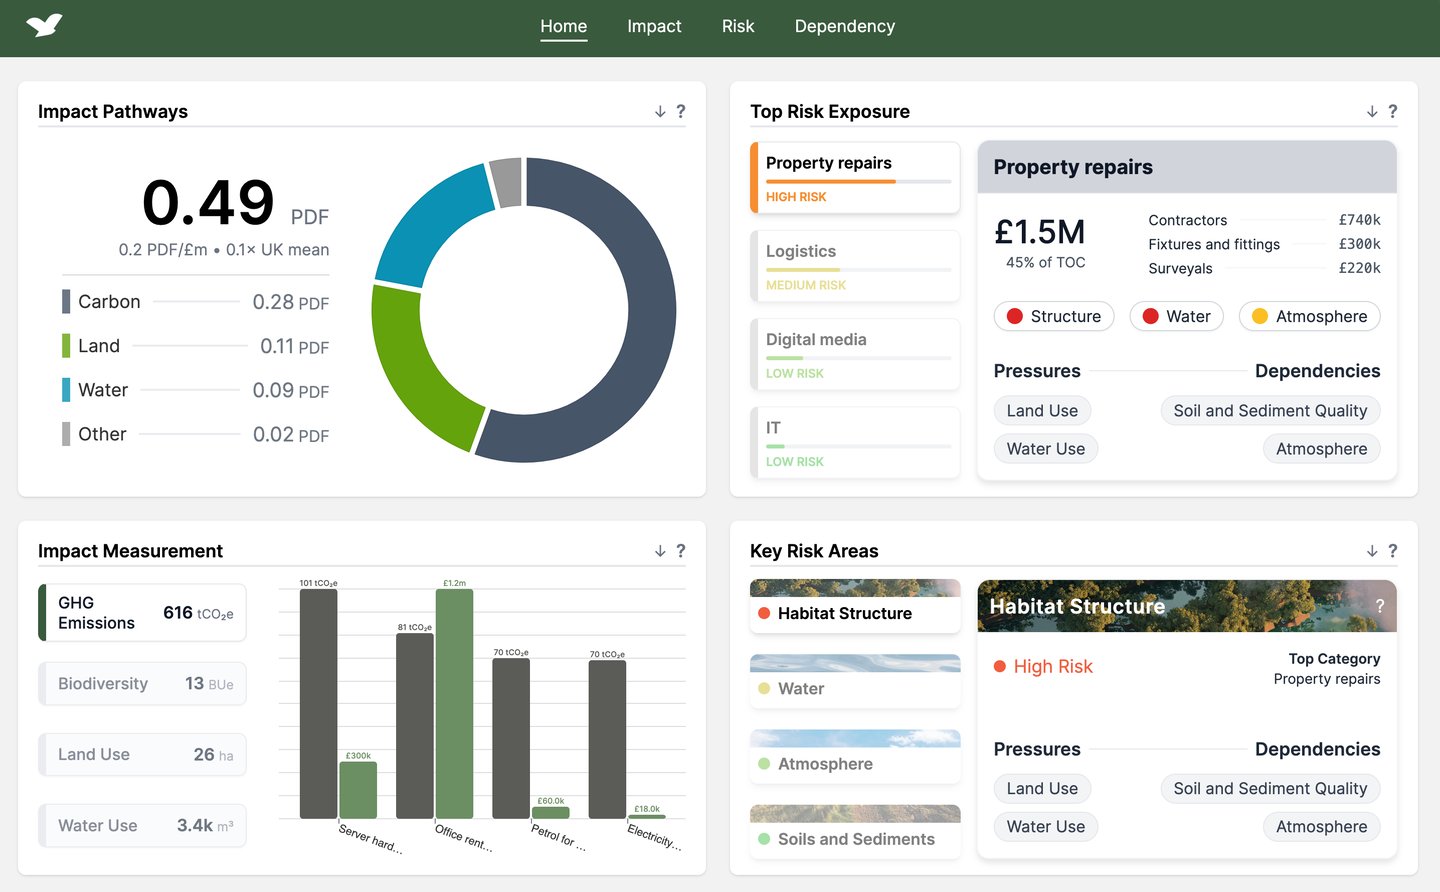
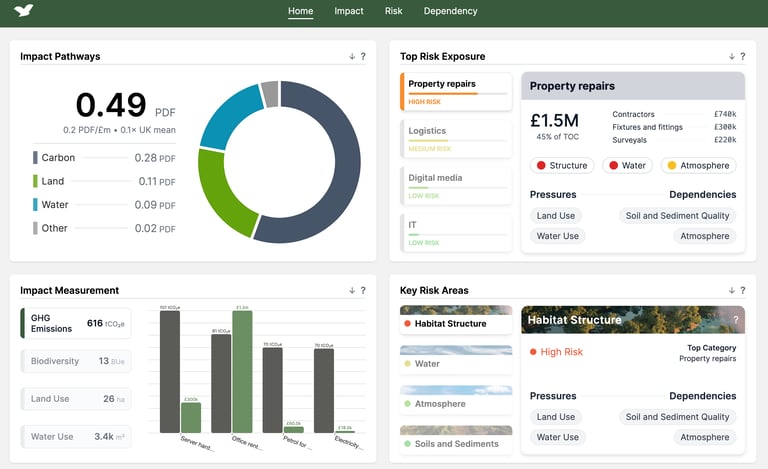
Impacts + Risks + Dependencies:
Klere’s Nature Impact Metric combines established, peer-reviewed and industry-recognised approaches to measure the nature cost of doing business.
EXIOBASE, ENCORE, Potentially Disappeared Fraction (PDF), and our own proprietary method based on the UK’s DEFRA Biodiversity Units, we assess biodiversity impacts, risks and dependencies across Scope 1, 2 and 3.
Starting with expense data, we offer an affordable way to reveal where nature pressures sit across your operations and supply chain.
Together, our metrics pinpoint the highest priorities, risks and most critical dependencies across ecosystems; giving a full picture of both carbon & nature across the supply chain.
Hear from our clients...
Working alongside sustainability consultants Greengage Environmental to determine the carbon footprint and nature dependencies, impacts and risks for real estate investment clients.
The aim? To give Greengage a full picture of their clients’ environmental impacts.
As Chris Moss, Principal natural capital consultant from Greengage explains,
“Using the platform, we were able to screen a huge amount of data, including financial data for multiple years. This gave us a ‘full picture’ of the client’s operations and value chain and the potential dependencies, impacts and risks associated with them. This detailed insight enabled us to pinpoint the key drivers for further consideration. The clarity between spend on activities, dependencies and impacts associated with those activities, and the resultant business-risk pathways really helped us to tell the story to our client; supporting prioritisation and defining clear next steps.”
Top nature dependencies (ecosystem services)- identified
Top risk pathways
1. Categories were the highest risk impacts
2. Risk components: Structural & Biotic Integrity, Water, Species...
3. Secondary risk clusters: identified
Top BUe impact (which activities ‘cost’ in lost biodiversity)
1. Overall (largest BUe impact driver)- provided breakdown by supplier
2. Supplier#1 contribution (% of BUe impact)
3. Flagged the contractors with biggest impact for deeper breakdown
Carbon Impacts across Scopes 1,2 and 3:
Supply chain GHG emissions measured # tCO2e, with % by Scope and full drill down by supplier, material, and business function.
How did the results help?
Baseline from which to build out impact reduction strategy
risk hotspots for immediate action
data backed narrative for supplier engagement.
Carbon & Nature in One Klere Platform
We know it can sound like a big task. But we will organise and enter all your expense data for you, ensuring the correct categories and using AI to speed up delivery.
We offer cost-effective analysis in just days to weeks. We make the complex, clear by providing you with presentable downloaded reports for decision making, communication and inputs suitable for sustainability reports/ TNFD/ CSRD. We provide a summary report of the toplines and next steps.
Click the video for a demo of the Klere platform.
We provide a full service...
Reporting Your Nature Impact
More than half of global GDP depends on nature. With biodiversity risk expected to cost the UK £70 billion by the late 2020s, nature risks need clear accounting.
All business is dependent on the resources nature provides from water, land to energy. We believe business is best placed to lead the way to nature restoration.
Our combined metric is a great starting point.
Using our metric businesses can:
Report- data to contribute to ESG reports & TNFD/CSRD
Develop action plans with proof of impact for grounded priorities
Data- baseline your sustainability decisions & actions
Communicate- a clear, organised tool for communicating carbon & nature with your teams and stakeholders.
Klere Limited
Nature data and carbon capture.
enquiries@klere.uk
Tel: 0203 583 1263
© 2024. All rights reserved.